Global Dashboard
Centralized monitoring and governance console for your CoconutDB tenant.
The Global Dashboard is the centralized monitoring and governance console for your CoconutDB tenant. It provides administrators with real-time visibility into platform usage, storage consumption, application health, security events, and audit activity.
The dashboard is organized into three sections:
- Tenant Overview: Summary of active users, workspaces, tables, and storage consumption.
- Usage & Health: Performance metrics, API analytics, response latency, and error trends.
- Security & Reliability: Authentication security, suspicious activity flags, audit event registry, and SMTP mail health.
1. Tenant Overview
The Tenant Overview provides a high-level summary of your CoconutDB environment. It allows administrators to understand how the platform is being used, monitor resource consumption, and identify areas that may require optimization or capacity planning.
KPI Cards
The KPI Cards provide a quick snapshot of your tenant. Typical metrics include:
- Total Registered Users
- Total Workspaces
- Total Dynamic Tables
- Database Size

Why it matters
Administrators can quickly determine the current scale of the tenant and monitor growth over time.
Storage & Quotas
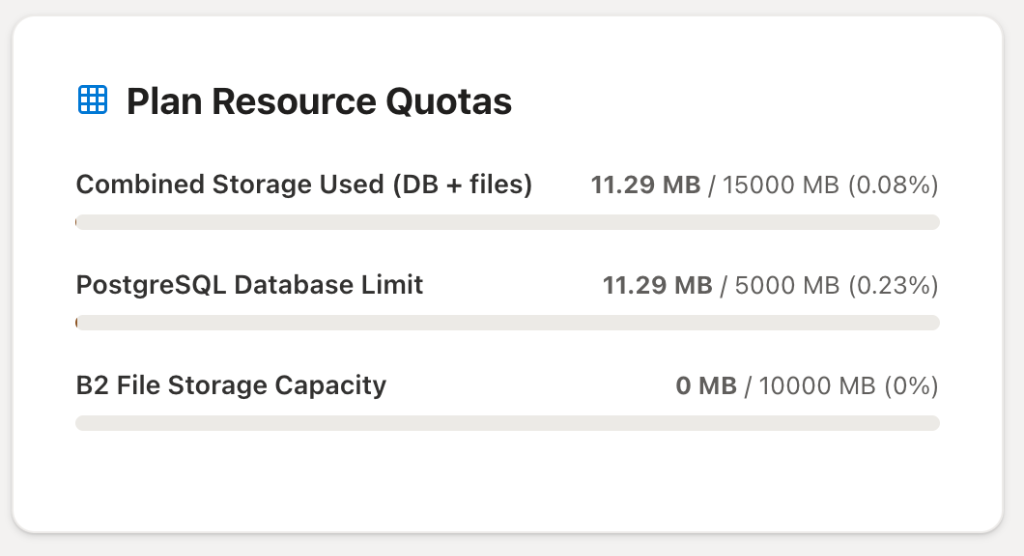
This section displays how much storage has been consumed compared to the allocated plan limits. Typical metrics include:
- Combined Storage Usage (sum of db, storage, and back-ups)
- PostgreSQL Database Usage
- File Storage Usage (Document Vault uploads)
- Backup Storage
Why it matters
Monitoring storage consumption helps prevent unexpected quota limits and supports infrastructure planning as applications grow.
API Usage
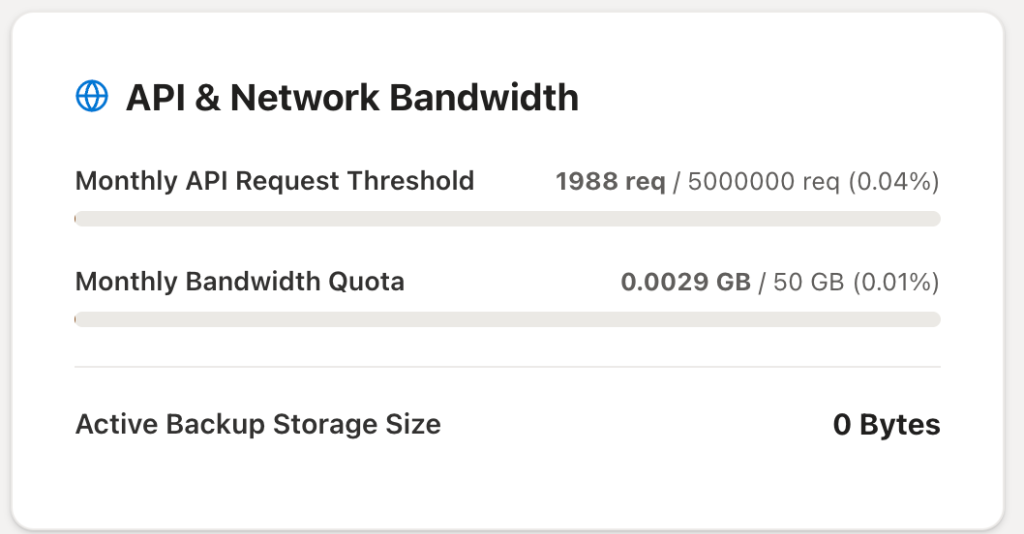
This section summarizes platform consumption related to API traffic and network resources. Typical metrics include:
- Monthly API Requests
- Network Bandwidth Usage
- Backup Storage Usage
Why it matters
Tracking API usage helps identify rapidly growing applications, estimate future resource requirements, and ensure that workloads remain within plan limits.
Database Insights
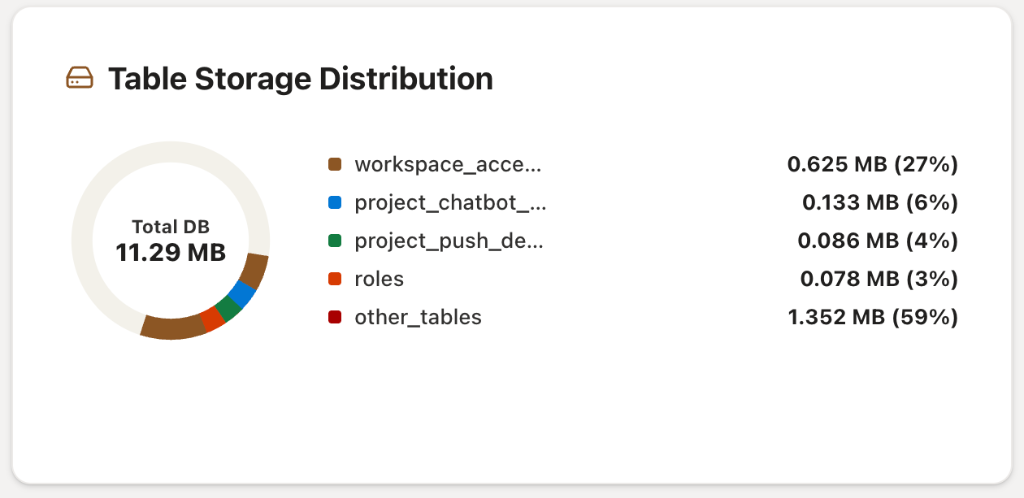
Database Insights provide information about how storage is distributed across the tenant. Examples include:
- Storage consumed by each table
- Largest tables in the database
- Tables containing the highest number of records
Why it matters
Understanding data distribution helps optimize database design, improve query performance, and identify opportunities for cleanup or archiving.
2. Usage & Health
The Usage & Health section focuses on platform performance, application activity, and operational health. It enables administrators to monitor system responsiveness, API performance, and database growth in real time.
Performance Metrics
Performance Metrics measure how efficiently the platform is operating. Typical indicators include:
- Average API Response Time (latency)
- Peak Requests per Minute (RPM)
- Response Success Rate
- Active Database Connections
- Workflow Execution Latency

Why it matters
Performance monitoring enables teams to detect bottlenecks early and maintain a reliable user experience.
API Analytics
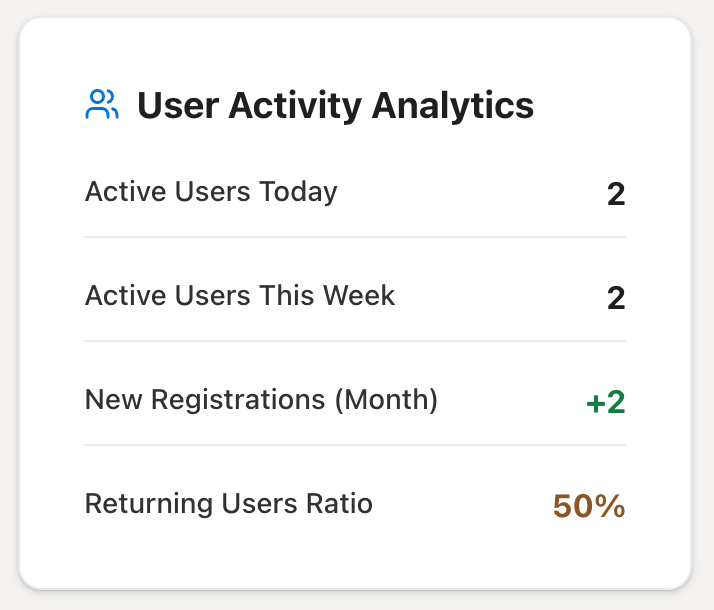
API Analytics provides insight into how applications are interacting with CoconutDB. Typical metrics include:
- API Requests Today
- Request Trends over 7 and 30 days
- Peak Traffic Hours
- Success Rate vs Error Rate
- Average Latency Breakdown
Why it matters
API analytics helps ensure that applications continue to operate efficiently while supporting capacity planning and troubleshooting.
Database Growth
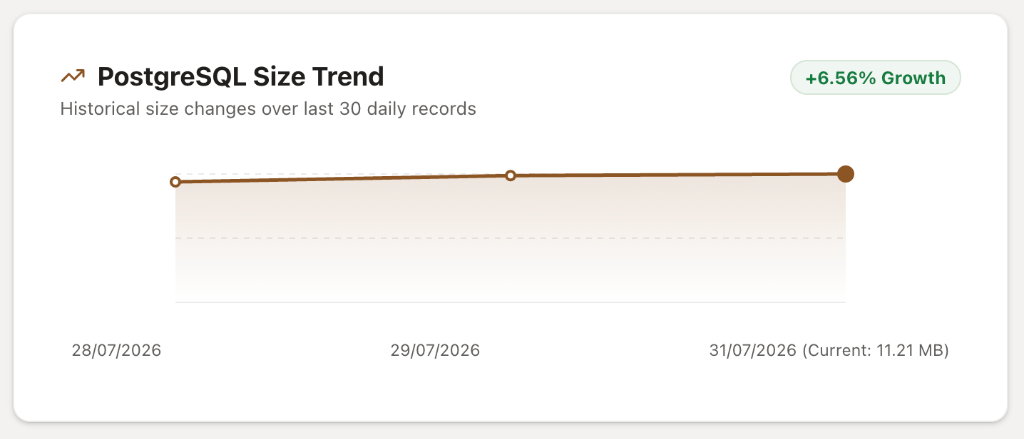
Database Growth tracks changes in database size over time. Historical trends allow administrators to monitor how quickly storage is increasing. The graph can reveal: steady growth, unexpected storage spikes, large data imports, and cleanup/pruning events.
Why it matters
Historical growth trends support capacity planning and help predict when additional storage may be required.
HTTP Status Distribution
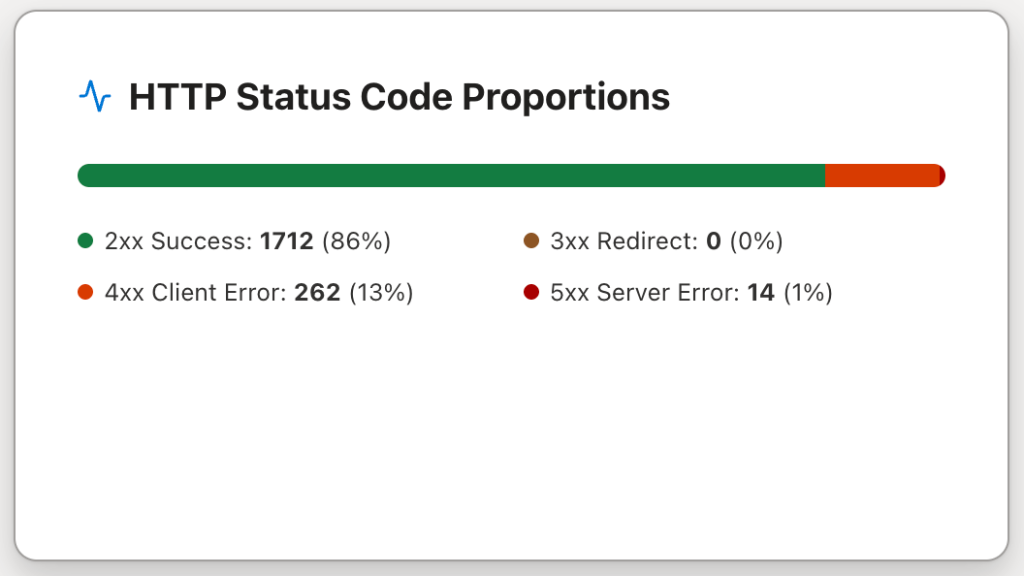
This section categorizes API responses by HTTP status code, such as:
- 2xx – Successful requests
- 3xx – Redirect responses
- 4xx – Client errors (e.g. auth failures, missing data)
- 5xx – Server errors (e.g. timeout, script failures)
Why it matters
A sudden increase in 4xx or 5xx responses may indicate authentication issues, incorrect API usage, or application failures requiring immediate attention.
3. Security & Reliability
The Security & Reliability section provides visibility into platform security, authentication activity, audit records, and operational reliability. It enables administrators to monitor security events and investigate suspicious behaviour across the tenant.
Authentication Metrics
Authentication Metrics summarize user authentication activity. Typical indicators include failed login attempts, authentication failures, active developer API Keys, and total security audit events.

Why it matters
Monitoring authentication failures helps identify unauthorized access attempts and potential security risks.
Suspicious Activity
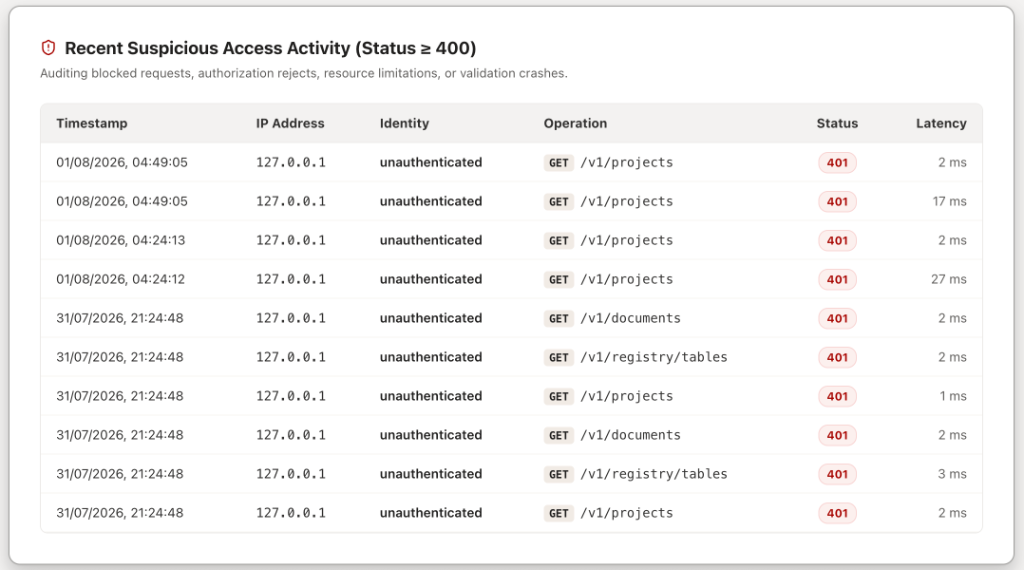
This section displays requests that resulted in security-related events. Logged details capture the timestamp, IP address, user identity, API endpoint, HTTP status, and request latency.
Why it matters
Administrators can quickly investigate suspicious requests, identify attack patterns, and respond to security incidents.
Audit Events
Audit Events record important operations performed within the platform. Examples include record creations, updates, deletes, schema changes, user role changes, and configuration updates. Each audit entry includes information about who performed the action, when it occurred, what changed, and which resource was affected.
Why it matters
A complete audit trail improves transparency, simplifies troubleshooting, and supports governance and internal compliance requirements.
SMTP Monitoring
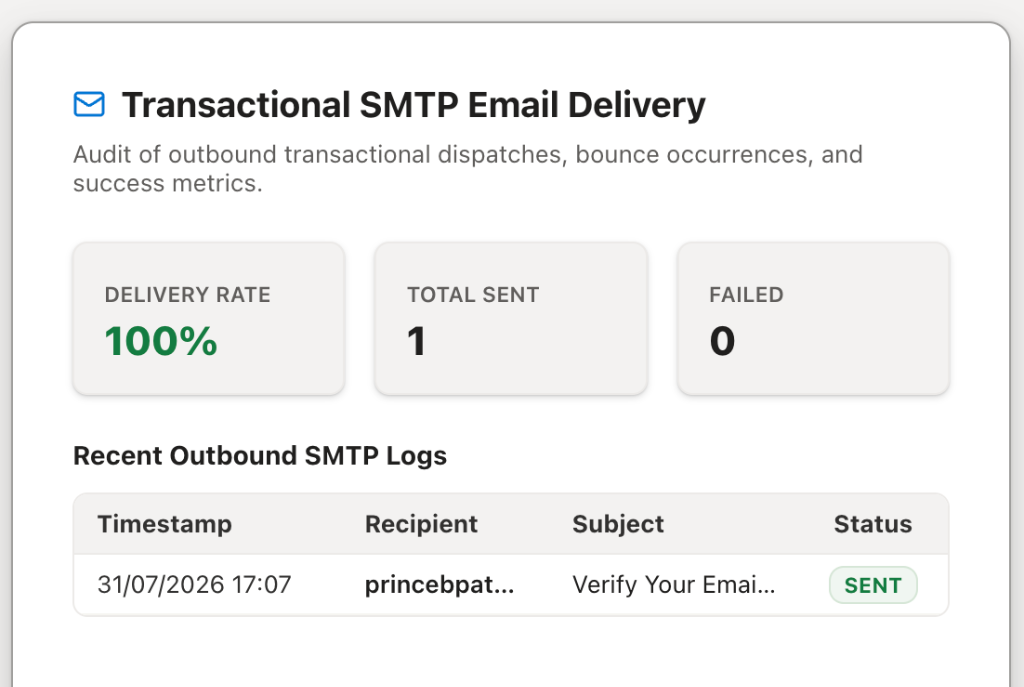
SMTP Monitoring provides visibility into transactional email delivery. Typical metrics include delivery success rate, total emails sent, failed deliveries, and recent email activity.
Why it matters
Reliable email delivery is essential for features such as user registration, password recovery, OTP verification, and system notifications. Monitoring these metrics helps ensure that important communications are successfully delivered.